Airplane Incidents Data Visualization

Link to the GitHub repository: https://github.com/nazanin-tabatabaei/DataVizFinal
Design Overview:
In the planning phase of this project, the Airplane incidents dataset really stood out to us. We thought there’d be many avenues in which we could explore visualization with this dataset such as finding out where plane crashes mostly happened, injury rates, etc. However upon implementing this visualization we realized the true challenge we faced!
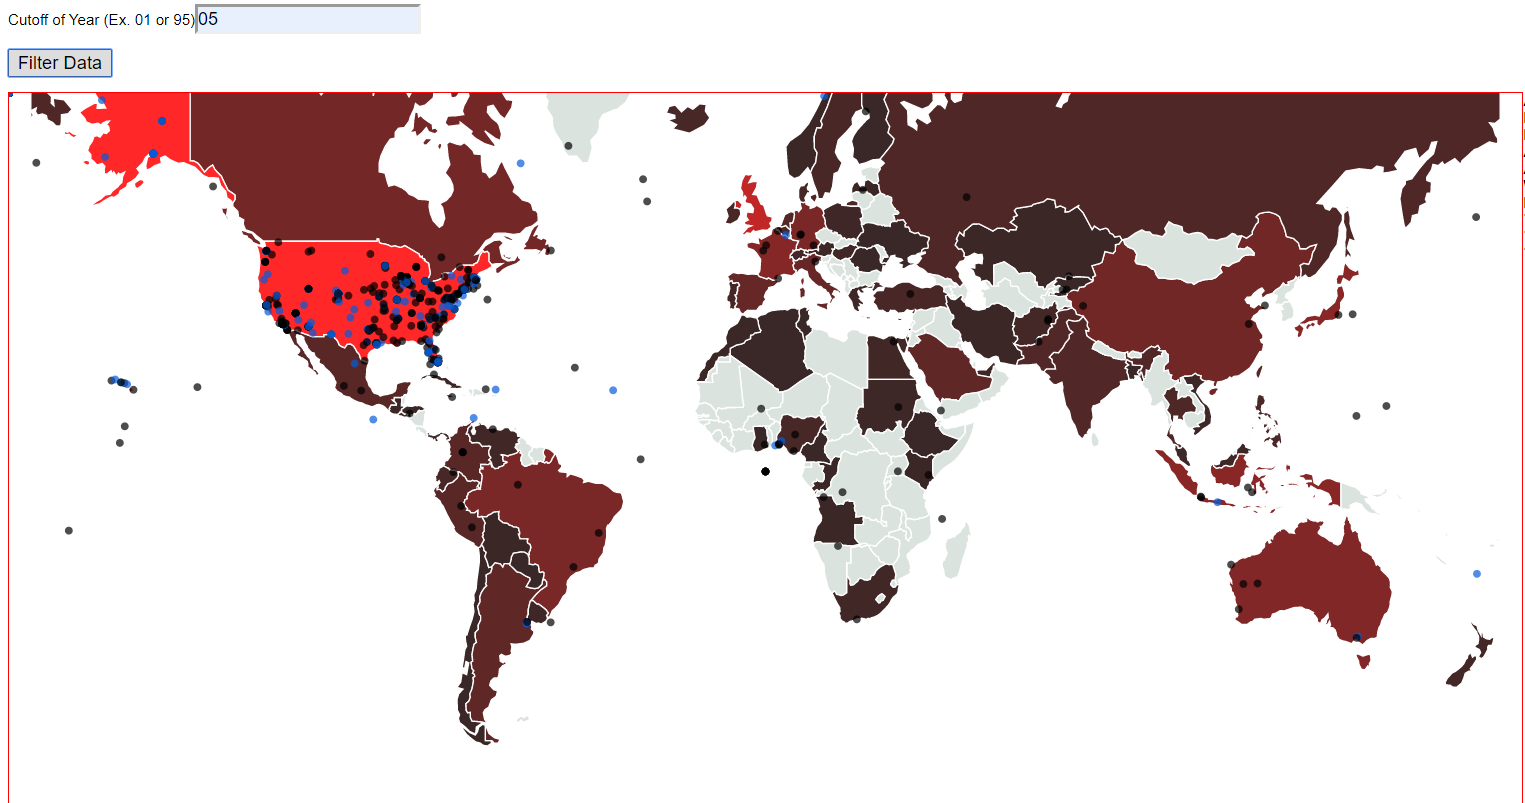
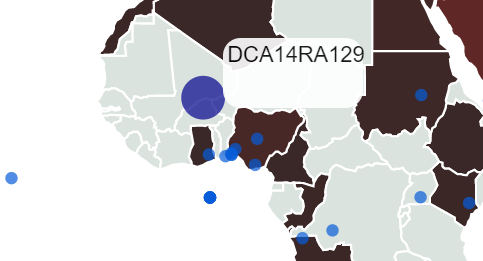
In our visualization, we had a heavy focus on showing the user where plane crashes happened so we created a map that had circles representing the crash locations. We also wanted the user to easily be able to find information a specific crash so if they were interested in a crash that happened in the middle of the ocean or in the middle of Russia all they have to do is click the circle they are curious about and they can get more information.
Furthermore, we wanted to have a broad representation of crashes and countries so we created a bar graph below the map that aggregated the crashes in specific countries and put them side by side so the user can easily see the differences.
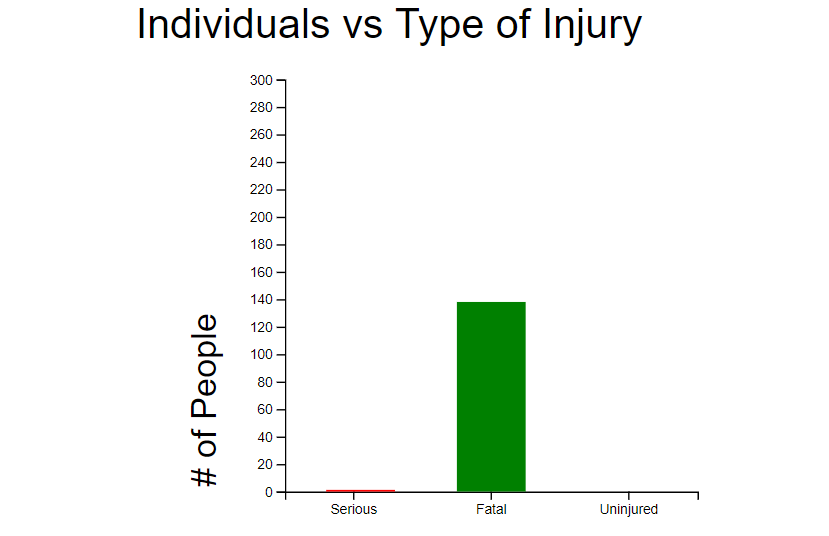
Also we wanted to display one of the most important aspects of these incidents, human casualty, more visually so every time a point is clicked you get a visual representation of how many serious, fatal, and uninjured passengers there were.
Lastly, we wanted to make the map easily tell the user were higher clusters of crashes were happening so we correlated the lightness of red with more crashes.
User tasks/taxonomies our visualization supports:
Find extrema - Using the linked graph below the world map representation, the extremum of countries are easy to find
Details on Demand - When hovering over a specific point, you can see the accident number for that point. Furthermore, When clicking on a specific point, one is able to see all the details surrounding a plane crash incident. The accident detail box retrieves values including accident number, event date, location, airport name, air carrier, weather conditions, injury severity, total fatal injuries, total serious injuries, and total uninjured. Also these details clear out as soon as another point is clicked.
Overview first - Our map and graph support and overview first mentality, you can see the trends of the countries with the bar graphs and see where many clusters are all over the map
Cluster - The map has points all around the world that represent plane crashes and these points naturally cluster in regions that are easily visible and easy to see for the user
Search vs Browse - The user can easily browse by looking around the map at different points, but then search by hovering over the points and seeing the specific accident number
Compute Derived Value - When a point is clicked a bar graph is created that computes the derived value of serious injuries, fatal injuries, and total uninjured. In addition, We have used this taxonomy to create the aggregated values for the number of accidents in each country.
Filtering - When the user types a specific year number in the filter box, they can filter every incident that took place after the specified year.
Screenshots & Commentary:
In this visualization the user can see the world map populated with the airplane accidents. Longitude and Latitude of the accidents were used to determine the location of these points. By hovering over each of these points the user can see the accident number.
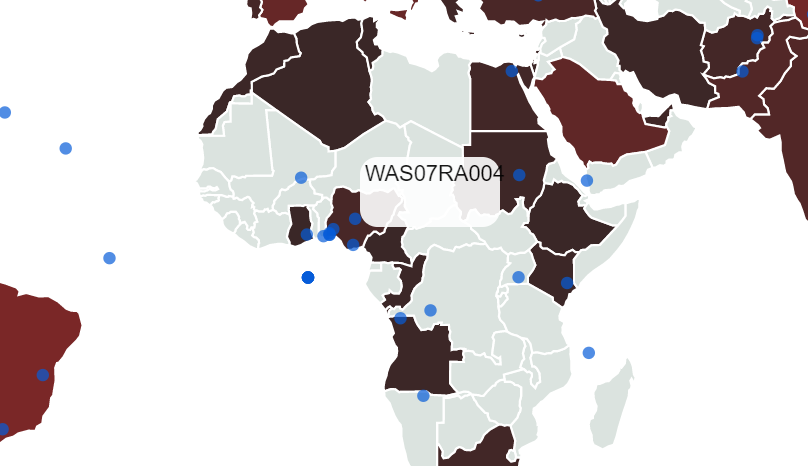
If they are interested to learn more about them, they can select them to see more detail on demand.
The incident detail area on the right retrieves information about the Accident Number, Event Date,Location, Airport Name, Air Carrier and Weather Condition.
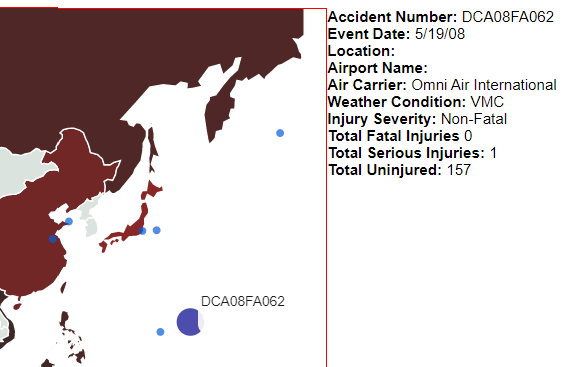
Furthermore, they can easily get an understanding of the severity of the selected incident by a barchart visualization showing the number of Total Fatal Injuries, Total Serious Injuries and Total Uninjured.
In another visualization we have computed the total number of accidents per country. Potentially hovering over each country can highlight the corresponding bar to show the number of airplane accidents in that country.
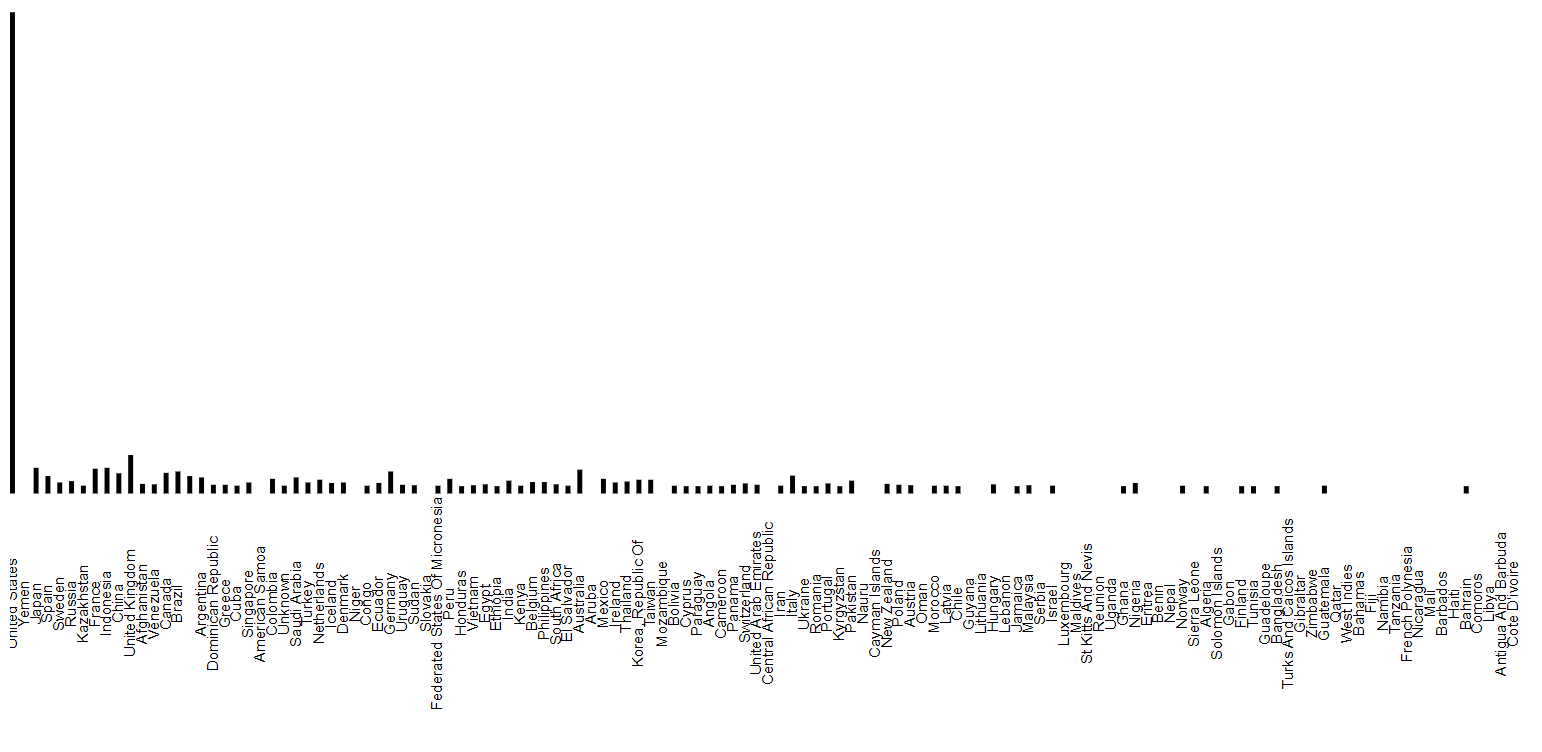
this visualization also includes filtering capabilities. The user can type a specific year to filter every incident that took place after the specified year.